Widget Dashboards
Widget Dashboards enable data to be displayed in many different ways, for example, Pie Chart, Gauge, Heat Map or Data Grid.
Multiple Widgets using data from different Pathways can be used in a single Widget Dashboard enabling you to display all your data in one place, with options to add in organisation logos using the Card Widget.
The following Widgets are available:
Bar Charts
| Widget | Descriptions |
|---|---|
|
Bar Chart
The example below displays SMS Consent for patients aged 16 and over:
|

|
Side-by-Side Bar Chart Display data by date across multiple indicators. The example below shows SMS Consent (blue) and SMS Dissent (red) for patients aged 16 and over.
|
|
Stacked Bar Chart
The example below shows the total patients aged 16 and over, with SMS Consent (blue) or SMS Dissent (red) status:
|

|
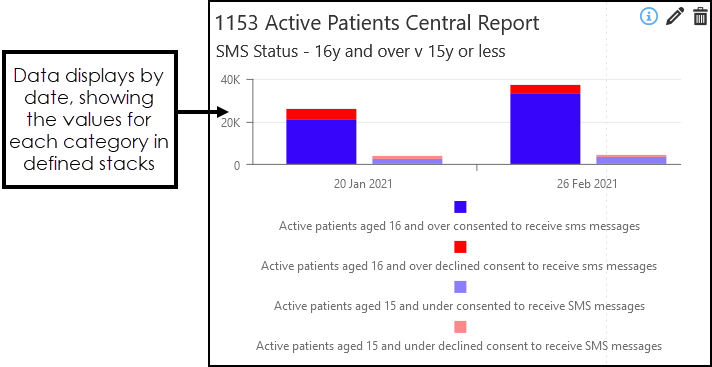
Stacked Side-by-Side Bar Chart This chart displays data by date, with the values for each indicator in different colours. You can define which indicator displays in which stack to allow comparisons. For example, here we are looking at SMS Consent and Dissent, comparing 16 years and older, with 15 years or less:
|
|
100% Stacked Bar Chart
The example below shows the total patients aged 16 and over, with SMS Consent (blue) or SMS Dissent (red) status displays as a percentage:
|

|
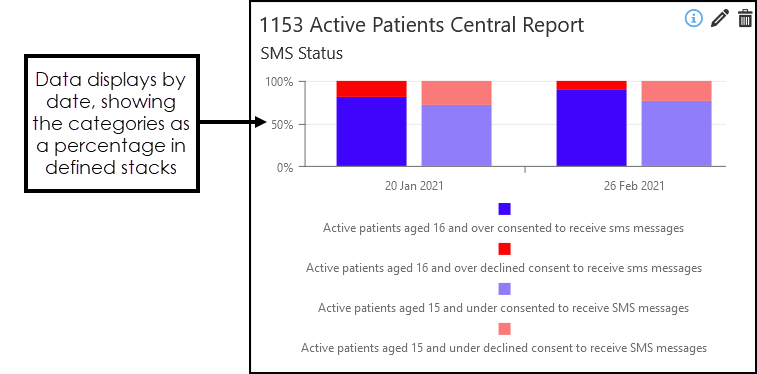
100% Stacked Side-by-Side Bar Chart This chart displays data by date, showing relative percentage of multiple data series in stacked bars, where the total (cumulative) of the stacked column always equals 100%. Each indicator displays in different colours. You can define which indicator displays in which stack to allow comparisons. For example, here we are looking at SMS Consent and Dissent, comparing 15s and under (purple - consent, pink - dissent), with over 16s (blue - consent, red- dissent):
|


Line Charts
| Widget | Descriptions |
|---|---|
|
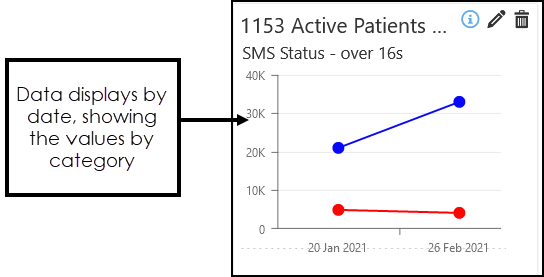
Line Chart Data displays by date, showing the actual values by indicator to display the trends. The example below, shows SMS Consent (blue) and SMS Dissent (red) for patients aged 16 and over:
|

|
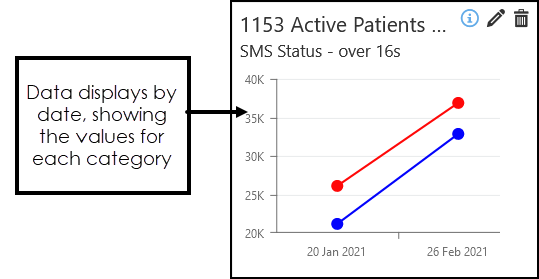
Stacked Line Chart This display combines data by date, with the individual values for each indicator in a different colour. The example below shows the total patients aged 16 and over, with a SMS Consent (blue) or SMS Dissent (red) status:
|
|
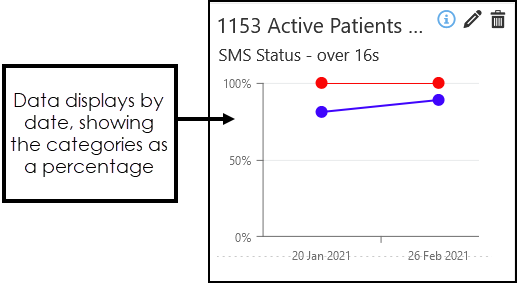
100% Stacked Line Chart The data displays by date, showing the data as a representation of 100%. The example below shows the total patients aged 16 and over, with a SMS Consent (blue) or SMS Dissent (red) status displayed as a percentage:
|
Area Charts
| Widget | Descriptions |
|---|---|
|
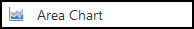
Area Chart This combines the line and bar chart to display data over a period of time, indicators display actual values in different colours. For example, SMS Consent (purple), SMS Dissent (pink):
|

|
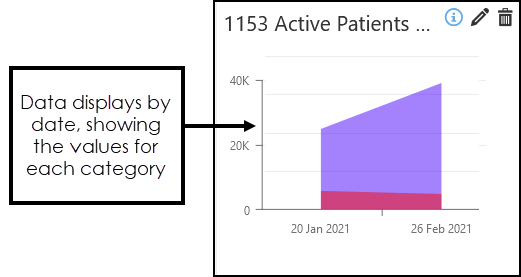
Stacked Area Chart This combines the line and bar chart to display data by date over a period of time, the total value displays, with the values for each indicator display in different colours. The example below shows the total patients aged 16 and over, with a SMS Consent (blue) or SMS Dissent (red) status:
|

|
100% Stacked Area Chart This chart combines the line and bar chart to display data over a period of time and stacked so that the cumulative area always represents 100%. The example below shows the total patients aged 16 and over, with a SMS Consent (blue) or SMS Dissent (red) status displayed as a percentage:
|

Gauges
| Widget | Descriptions |
|---|---|
|
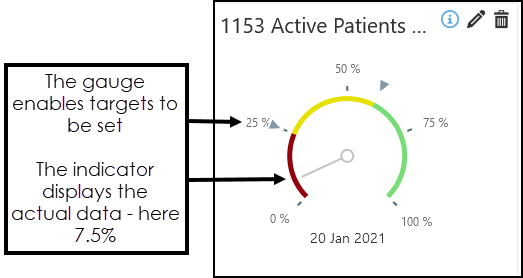
Circular Gauge The Circular Gauge displays data as a percentage on a circular scale. Below the lower target displays red, after the first target displays yellow and after the second target displays green. This can also be reversed, so green is the initial colour and red the third colour, where the target is to reduce the value, for example, Hospital DNAs. The Indicator shows the current value. The example below displays SMS Consent for patients aged 16 and over, with an initial target of 25%, and a further target of 60%:
See - Create a Gauge Chart. |
|
Linear Gauge The Linear Gauge displays data as a percentage on a linear scale. Upper and lower alarm ranges can be set to show data within green, amber and red ranges Below the lower target displays red, after the first target displays yellow and after the second target displays green. This can also be reversed, so green is the initial colour and red the third colour, where the target is to reduce the value, for example, unplanned admissions. The Blue Line shows the current value. The example below displays SMS Consent for patients aged 16 and over, with an initial target of 25%, and a further target of 60%:
See - Create a Gauge Chart. |

Additional Widgets
| Widget | Descriptions |
|---|---|
|
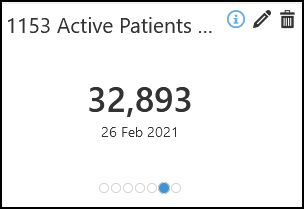
Card The Card Widget enables you to add additional text, images, or tables to supplement the information in your Dashboard. For example, add your organisation's logo, details of the author, and date created. See - Card Widget. |

|
Count This Widget performs a simple Count for the selected indicator.
See - Count Widget. |

|
Data Grid Data Grids display predefined indicator totals in a pivot grid format. Optionally, apply a range of filters to display data by date and a combination of: Country, Organisation or Practice. This is the same as the large data grid used in Central Reporting.
See - Data Grid. |
|
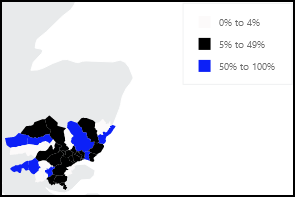
Heat Map The Heat Map Widget displays values for a single indicator as a percentage of the total, utilising the outward code of the patient's postcode, for example, SW18, to display a geographical representation of data using colour coding to illustrate different percentage ranges. The example below is from a Treatment Centre. It looks at patients who had their blood pressure taken, and the percentage that also had blood samples taken.
See - Heat Map. |
|
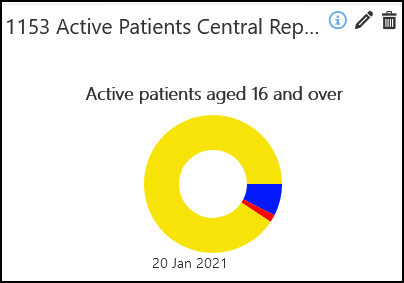
Pie Chart Pie Charts are divided into segments for representing Primary indicator and further segments display as a percentage. After selecting a Primary Indicator, for example, all active patients aged 16 and over, Segment Indicators can be selected, for example, SMS consent status, which display as a percentage of the Primary Indicator. In this example, the percentage of patients consented (blue) and dissented (red) to the use of SMS messages.
See - Create a Pie Chart. |